Archive for April, 2012

Information graphics, visual representations of data known as infographics, keep the web going these days. Web users, with their diminishing attention spans, are inexorably drawn to these shiny, brightly coloured messages with small, relevant, clearly-displayed nuggets of information. They’re straight to the point, usually factually interesting and often give you a wake-up call as to what those statistics really mean.infographics

Who can resist a colourful, thoughtful venn diagram anyway? In terms of blogging success, infographics are far more likely to be shared than your average blog post. This means more eyeballs on your important information, more people rallying for your cause, more backlinks and more visits to your blog. In short, a quality infographic done well could be what your blog needs right now.


Designing An Infographic

Some great tips for designing infographics:

  • Keep it simple! Don’t try to do too much in one picture.
  • Decide on a colour scheme.
  • Research some great facts and statistics.
  • Think of it as a visual essay: ensure your arguments hold and are relevant.
  • Remember that it’s all about quickly conveying the meaning behind complex data.
  • Draw conclusions.
  • Reference your facts in the infographic.
  • Include your URL so people can be sure who made it.

infographics

Ideas for infographic formats include:

  • Timelines;
  • Flow charts;
  • Annotated maps;
  • Graphs;
  • Venn diagrams;
  • Size comparisons;
  • Showing familiar objects or similar size or value.

Here are some great tutorials on infographic creation:

Creating Your Infographic

  • Plan and research.
  • If required, use free software to create simple graphs and visualisations of data.
  • Use vector graphic software to bring these visualisations into the one graphic.

Ultimately, if you have a little design skill, the very best approach is to create all the simple graphs and illustrations yourself using vector graphic software. Your end result will be more visually attractive and you will have more freedom to be creative with it.


Free Online Tools For Creating Infographics

Stat Planet

Stat Planet allows you to create some amazing interactive visualisations, which you can then use as is or create a static image. It can be used within your browser or downloaded for free. Stat Planet gives you access to some great world data and lets you customise that in your visualisations. It also has some great map-based visualisations to try.

information graphics

Hohli

Hohli is an intuitive, simple online chart maker. It’s incredibly easy to pick your chart type, add some data, vary the sizes and colours and see the finished chart. The finished charts are also very well designed and look great!

information graphics

Creately

Creately lets you make easy-to-make diagrams and flow charts (easy to collaborate too). When you start, you can choose from a number of purpose-designed diagram types and quickly add your data to make your own chart. The end result looks very professional.

information graphics

New York Times

New York Times’ Visualization Lab lets you use statistics from recent NYTimes articles to create visualisations in various formats. You can also see other people’s visualisations and see how other people choose to display the same data.

data graphics

Many Eyes

Many Eyes lets you upload your own data or use data already stored on the site. The visualisations themselves are well-designed and very professional-looking. This is definitely the easiest way to use your own data for online visualisations.

data graphics

Google Public Data

Google Public Data lets you easily take public data and transform it into an infographic of your choice. These beautiful, colourful graphics simplify and communicate the data perfectly.

data graphics

Wordle

Wordle lets you create word visualisations using text you enter. There are plenty of interesting designs to choose from. Enter whole books, short passages or see what other people have used. In this example, we can see the US constitution visualised.

Free Software For Creating Infographics

Tableau

Tableau is a free Windows-only software for creating visualisations. As you can see, these impressive graphs are colourful and quite unique.

Gapminder

GapMinder is a free Adobe Air (cross-platform by nature) application to ensure you have current data on major world issues and can create visualisations for your purposes. Data is updated yearly and released with new versions of the application. The visuals are also quite impressive!

Inkscape

Inkscape is a free vector graphic software available for many platforms. This is the ideal free option for the creation of your overall infographic. Simple and intuitive, you should have no problems importing your visualisations and combining them with other visuals to create your masterpiece.

infographics

Love Infographics?

If you’re a fan of infographics, these tools will probably become part of your everyday blogging tools. Feel free to let us know of more great tools in the comments!

Also, check out some of MakeUseOf’s favourite infographics:

Another great free ebook from our friends at Hubspot – Enjoy!

Two new networks have emerged on the social media landscape, demanding the attention of marketers. google+, with more than 100 million active users, and pinterest, now the third most-popular social network in the u.s., are competing for wide adoption and luring businesses that want to keep up with the new hangout spots of their audiences… Where should you market your business?

Digital Guerilla Powerful Web Design Sydney

EBOOK google_plus_vs_pinterest_where_should_you_market_your_business

Graham Knowles Digital Guerilla

Are you riding the Pinterest wave? Many are quite with the new social media darling, but the BIG question is will Pinterest ever make any money?  

Julian Green is the Founder of Jetpac, founded Houzz, has been starting and running technology businesses in Silicon Valley since 1998, including six years as a senior executive at eBay – he argues that the image-browsing site Pinterest may be the new social-media darling – but people won’t actually buy anything through it…

For those who haven’t been madly pinning, Pinterest is a wildly successful image browsing website. Before the internet, we used to browse beautiful things for free by roaming the aisles of shops, or cutting pictures out of old magazines and sticking them to the wall. Now we have Pinterest and a range of social curation sites that enable us to search for and pin gorgeous images to virtual boards, and then share them. Eventually Pinterest will have to make money, but it will have to be from browsers, not buyers, because Pinterest won’t drive significant purchasing…

Read the full article in the Telegraph

Consumers are now as willing to share online adverts as clips that other users have taken. These are currently the Internet Advertising Bureau’s most popular for the UK.

1. Peugeot Mood Paint 

This April Fool’s suggests that new paint will change colour depending on the mood of the driver. Which could mean all cars in traffic jams would be red.

2. Go Beyond The Cover
Watched more than 9million times, this Dermablend commercial sees a surprising transformation.

3. Steamy Windows by Irn Bru 
Irn Bru cements its cheeky image with this 30-second commercial about a son who discovers his parents thought he’d gone out…

4. Danny MacAskill – Way Back Home
Watched nearly 19million times, this film covers BMX rider Danny MacAskill’s journey from Edinburgh to Skye.

5. Assassin’s Creed 3
The reveal trailer for this 18-rated video game is atmospheric, and mixes live action with computer graphics.

6. The CONtract feat. K-Orville 
An advert from O2-owned mobile company giffgaff, featuring rehomoned battery chickens, rapping and Orville. Of course.

7. Game of Thrones 
A teaser trailer for season two of this popular HBO series.

8. Introducing the Marshall Fridge 
Is it an amp? No it’s a fridge. “The coolest icon in music just got cooler.”

9. Guinness on St Patrick’s Day 
Guinness takes a visit to the sheep dog trials. Nearly 2.3million viewers have added to the capacity crowd of 16 on film.

10. David Attenborough’s Wonderful World 
David Attenborough does Duke Ellington’s classic. Almost sings it, but not quite.

Graham Knowles www.digitalguerilla.com.au

 If your business or  not for profit organisation has yet to start using Pinterest, then hopefully new data released for March 2012 revealing  that Pinterest now generates more referral traffic than Twitter will motivate you to start pinning – or at the very least to sign up and reserve your first choice of usernames (hint, hint!).  below you’ll find nine Pinterest Best Practices.  Enjoy and start pinning!

1. Pin your own website and blog content, but only if it pulls up a good photo!

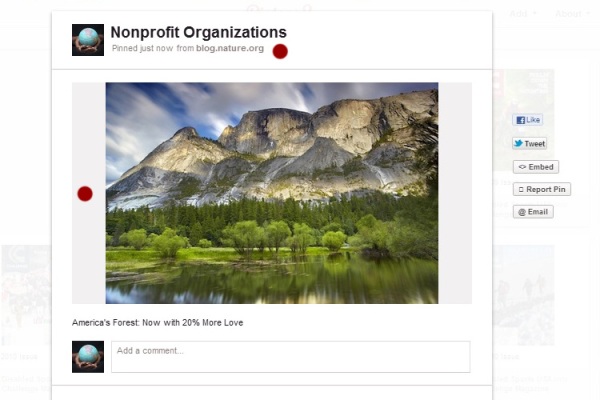
As mentioned above, Pinterest is quickly becoming a boon for referral traffic. Tap into that power by pinning your own website and blog content, but only if it pulls up a good, visually appealing photo. Powerful visuals are what is driving the Pinterest community and referral traffic. So, for example, I am going to pin a blog post from the Nature Conservancy Blog:

Step One :: Use Good Photos on Your Website and Blog

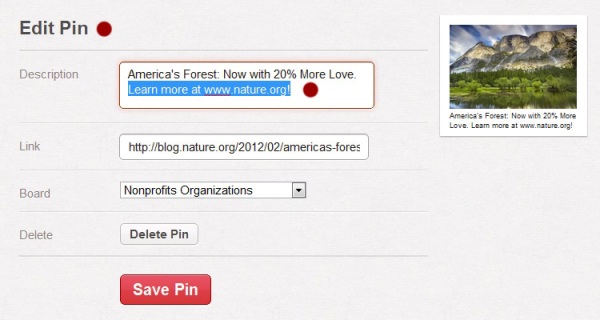
Step Two :: Pin It!

Step Three :: Review Pin and Test Link

Note that there is a link to the blog post in the pin and that clicking the photo
also links back to original blog post:
pinterest.com/pin/203154633160827750/

2. Add quality descriptions to your Pins.

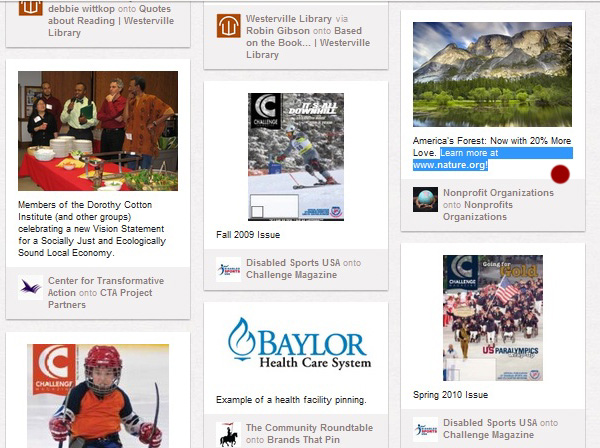
Many organisations are rushing through the process of adding descriptions to their pins and it shows. Your descriptions should reflect how your pins relate to your mission or be used to call the Pinterest community to action. They shouldn’t be more than a sentence, but 2-3 words is usually not enough. That said, please also use proper punctuation and grammar in your descriptions! Most descriptions are a complete mess and as seen below descriptions get prominent placement, so make sure your descriptions give a good first impression:

3. Add website links to your Pin’s descriptions.

You can add a website link while pinning or you can “Edit” your description after pinning to add a link. It’s worth noting that you do not need to put “http://” in front of the website URL. Keep the URL simple and short, but don’t miss an extra opportunity to increase your referral traffic from Pinterest.

4. Add #hashtags to your Pin’s descriptions.

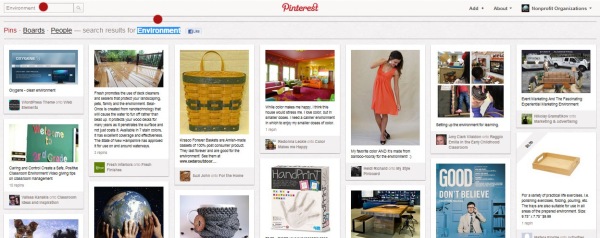
Similar to adding hashtags to tweets, you can also add hashtags to descriptions to increase the likelihood of your nonprofit’s pins showing up in Pinterest searches. Be sure to use common search terms or hashtags and avoid being a hashtag spammer. One hashtag per pin is enough!

5. Add your logo or avatar to your images.

In terms of branding, it’d be wise to add your logo or avatar to some of your photos. You’ll need a photo editing tool to drag and drop your logo or avatar onto your images, but the extra step is worth your time. Here’s an example from Amnesty International:

6. Embed inspirational quotes onto your images.

Pinners love inspirational quotes! Tap into that phenomenon by embedding inspirational and quirky quotes onto your images, such as:

pinterest.com/pin/203154633160827892/

7. Add a price banner to your pins that are goods being sold or fundraising campaigns.

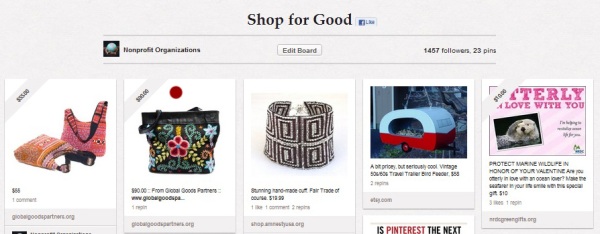
Many businesses are using Pintererst to sell products and  nonprofits offer donation gift programs or sell goods. Be sure to add a price to your pin description so that a price banner appears on your pin:

8. Space your Pinning throughout the day.

Similar to a tweet, a pin seems to have a peak lifespan of about 90 minutes, so space your pins accordingly. Logging in first thing in the morning to post ten Pins in a row isn’t a good use of Pinterest. Most people won’t ever see those pins and those that do may be annoyed that the volume of your pins have taken over their “Home” view  – especially if the pins are boring. Instead, post one or two pins every few hours and build your boards slowly. Remember… you are what you pin.

9. Monitor your Pinterest referral traffic.

You can easily track pins that are driving traffic to your website – both those pinned by you and others – by simply replacing your website URL in the URL below:

pinterest.com/source/YourWebsite.com

Graham Knowles  www.digitalguerilla.com.au

www.twitter.com/RAWTimes

Content marketing has been around for hundreds of years, but just now has it really gained prominent attention, where about 25% of marketing budgets are devoted to content marketing. Includes case studies from LEGO, John Deere, Blendtec, American Express and more.